YouTube Views per Subscriber: Data From 312 Big Channels
Free check
See if a creator's audience is real — free, no login.
How many of a YouTube channel’s subscribers actually watch a new video? Most published answers are rules of thumb copied from blog to blog. So we measured it. On October 28, 2026 we read the public upload feeds of 312 large YouTube channels across six niches, 8,686 videos in total, and computed what each channel’s recent uploads really earn against the subscriber count YouTube displays.
Key findings
- The typical long-form upload reaches 7.8% of a channel’s subscribers. That is the median across 309 channels. The middle half of channels sits between 3.3% and 20.2%.
- The share falls as channels grow. Channels with 1M–5M subscribers have a median of 9.0%; channels with 25M or more have 4.9%.
- Shorts earn fewer views per subscriber than long-form. On the median channel a Short gets 0.45 times the views of a long-form video. Shorts out-viewed long-form on only 52 of 251 channels (21%).
- The median like rate is 2.1% of views on long-form, and it also drops with size, from 2.8% (under 1M subscribers) to 1.35% (25M+).
- One channel in six had not posted a long-form video in 90 days. 50 of 312 channels, holding 358 million subscribers between them. 26 had not posted one in over a year.
- 8.0% of long-form uploads disclose a sponsor in the description (372 of 4,677), from 19.9% in tech to 0.5% in fitness. That is a floor, not a ceiling. The method section explains why.
The full dataset is free to download and reuse: CSV, one row per channel and JSON, every video (CC BY 4.0, credit So Influential).
How we measured it
- The channel list. We used every YouTube channel in the So Influential creator directory: 312 well-known channels in six niches (entertainment, gaming, tech, food, finance, fitness), sized from 281,000 to 524 million subscribers, with a median of 4.62 million. It is a list of established creators, not a random sample of YouTube, so read the results as “what big channels look like”.
- Subscribers. The count YouTube itself shows on each channel page (for example MrBeast’s, which read “524M subscribers”). YouTube rounds it to three significant figures, so it is precise to within about 1%.
- Videos. YouTube publishes an RSS feed for every playlist, and every channel has two automatic upload playlists: long-form videos (the “Videos” tab) and Shorts. Each feed lists the 15 most recent uploads with YouTube’s own view and like counts (here is MrBeast’s long-form feed). We read both feeds for every channel. No third-party tracker and no estimate is involved.
- Views per subscriber. For each channel, the median view count of its long-form uploads that were at least seven days old, divided by subscribers. A video only a few days old is still collecting views, so it is excluded. A channel needed at least five such videos to be counted (309 of 312 qualified for long-form, 254 for Shorts).
- Like rate. Likes divided by views for each video, then the median per channel. Dislikes and comment counts are not in the feed, so this is likes only.
- Medians everywhere. One viral video would drag an average a long way. A median tells you what a normal upload does.
Two limits matter when you use these numbers. Views are lifetime-to-date, so a channel that posts rarely has older videos in its window, and older videos have had longer to collect views. And the feed shows 15 uploads, so for a channel posting daily that is two weeks of output, and for a monthly channel it is more than a year.
Views per subscriber, by niche
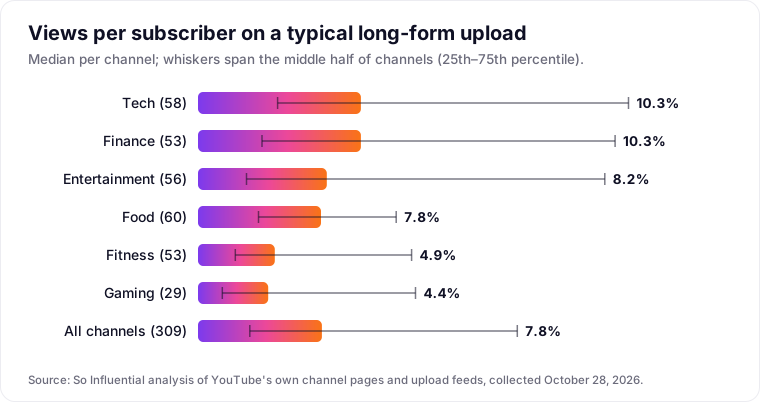
| Niche | Channels | 25th percentile | Median | 75th percentile |
|---|---|---|---|---|
| Tech | 58 | 5.0% | 10.3% | 27.2% |
| Finance | 53 | 4.1% | 10.3% | 26.4% |
| Entertainment | 56 | 3.1% | 8.2% | 25.7% |
| Food | 60 | 3.8% | 7.8% | 12.5% |
| Fitness | 53 | 2.4% | 4.9% | 13.5% |
| Gaming | 29 | 1.5% | 4.4% | 13.8% |
| All | 309 | 3.3% | 7.8% | 20.2% |
Tech and finance lead, and that fits how people use those channels: a phone review or a market explainer is something viewers search for, so videos keep collecting views from search long after the subscriber notification is forgotten. Fitness and gaming sit lowest. Gaming here is the 29 gaming creators in the directory who publish on YouTube; much of gaming’s live audience is on Twitch, which this study does not cover.
The spread inside every niche is wide. In entertainment the top quarter of channels pull more than 25% of their subscriber count per video, and the bottom quarter less than 3.1%. A single “good ratio” for a niche hides most of what is going on.
Bigger channels reach a smaller share
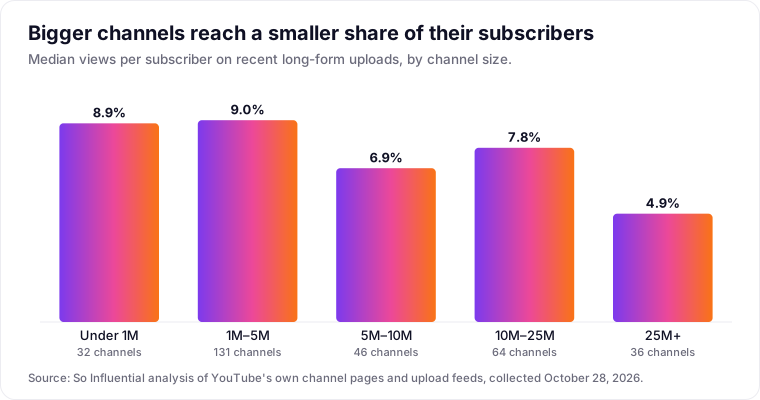
| Subscribers | Channels | 10th percentile | Median | 90th percentile |
|---|---|---|---|---|
| 281K–1M | 32 | 3.2% | 8.9% | 31.9% |
| 1M–5M | 131 | 1.6% | 9.0% | 35.3% |
| 5M–10M | 46 | 1.5% | 6.9% | 56.2% |
| 10M–25M | 64 | 0.8% | 7.8% | 42.4% |
| 25M+ | 36 | 1.0% | 4.9% | 36.4% |
The trend is not a smooth line, but the ends are clear: the biggest channels convert about half as many subscribers into views as the 1M–5M group. That is what you would expect from scale. A channel with 50 million subscribers collected many of them years ago, and YouTube never removes a subscriber who stopped watching.
The practical consequence for anyone vetting a creator: the same ratio means different things at different sizes. Below 1.6% puts a 1M–5M channel in the bottom tenth of its group, but at 10M–25M the bottom tenth starts below 0.8%.
Like rate: 2.1% is normal, and it falls with size
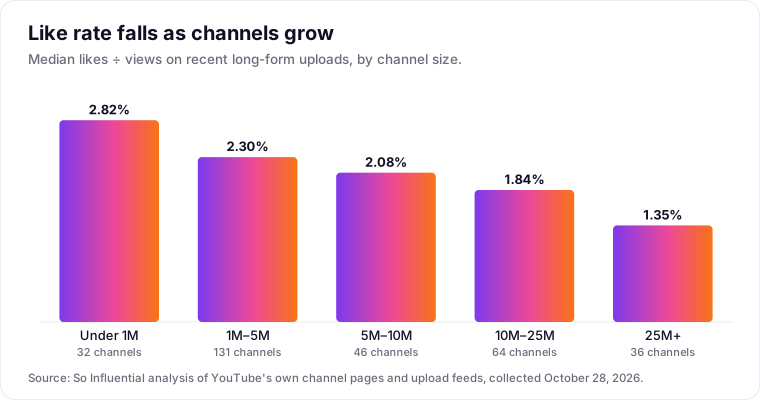
The median channel’s long-form videos collect one like for roughly every 47 views (2.11%). The middle half of channels sits between 1.38% and 3.15%. Size matters here too, and more steadily than for views: the median falls at every step, from 2.82% under 1M subscribers to 1.35% at 25M and above. Bigger channels reach more casual viewers who watch without reacting.
By niche, gaming has the highest median like rate (2.55%) and entertainment the lowest (1.77%). We go deeper on what counts as a normal ratio in What is a good like-to-view ratio on YouTube.
Shorts get fewer views per subscriber
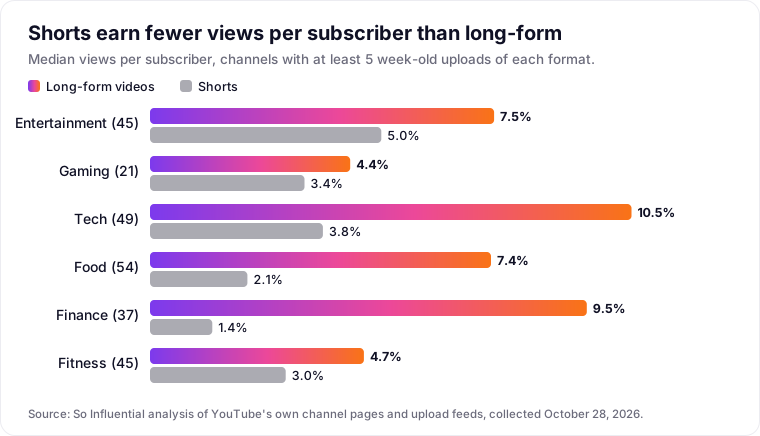
Shorts are often described as the fastest way to views. Measured per channel, on established channels, they are not. Among the 251 channels with enough of both formats, the median channel’s Shorts got 0.45 times the views of its long-form videos. Shorts won on 52 channels (21%), and that share rose with size: Shorts beat long-form on 13 of 33 channels with 25M+ subscribers. Finance shows the biggest gap: 9.5% of subscribers per long-form video against 1.4% per Short.
Shorts do get more likes per view: the Shorts like rate was higher than the long-form like rate on 179 of 249 channels (72%), with a median Shorts like rate of 2.74%. The full breakdown is in YouTube Shorts vs long-form views.
One channel in six has gone quiet on long-form
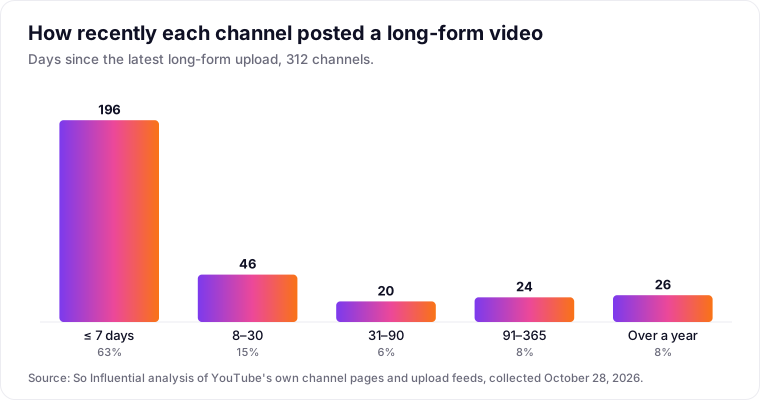
Most of these channels are busy: 196 of 312 (63%) had posted a long-form video in the previous week, and the median channel posted three in the last 30 days. But 50 channels (16%) had not posted a long-form video in more than 90 days, and 26 (8%) had not posted one in more than a year. Those 50 channels still display 358 million subscribers between them.
Not all of them are inactive. 11 of the 50 had posted a Short in the last 30 days, so they have moved formats rather than stopped. For a brand, both cases mean the same thing: the subscriber count describes an audience the channel built in the past. We cover how to check this before a deal in How to check a YouTuber is still active before you sponsor them.
How many uploads disclose a sponsor
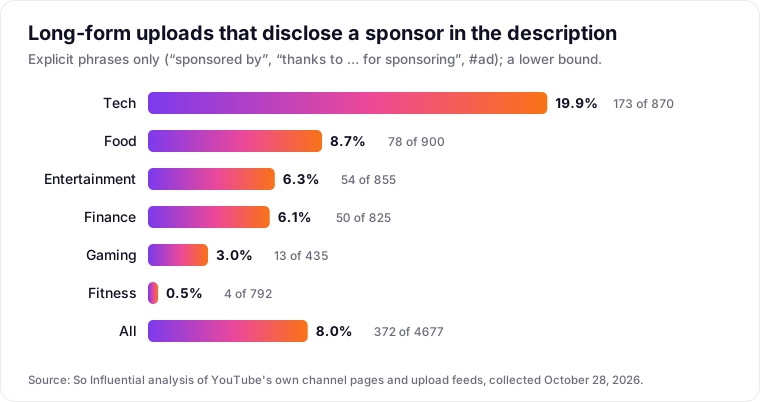
We counted a long-form upload as disclosing a sponsor when its description used an explicit phrase: “sponsored by”, “thanks to [brand] for sponsoring”, “this video is sponsored”, “today’s sponsor”, “#ad”, “#sponsored”, “paid promotion” or “paid partnership”. A phrase repeated in ten or more of a channel’s 15 descriptions was treated as a standing footer and not counted. On that test, 372 of 4,677 long-form uploads (8.0%) disclosed a sponsor in text, and 109 of the 312 channels did so at least once.
Read this as a floor. Many creators disclose a sponsor out loud in the video, or tick YouTube’s own paid-promotion setting, which adds a disclosure label at the start of the video but is not in the feed. We tried a looser test first (“sponsor” or “use code” anywhere) and dropped it because it matched lines such as “for sponsorship inquiries, email…” and “I do not do sponsored videos”. What the floor does show is a real difference between niches: one in five tech uploads names its sponsor in the description, against one in two hundred in fitness.
Do sponsored videos get fewer views? Among the 29 channels with at least three sponsored and three unsponsored week-old uploads in the window, the median channel’s sponsored videos got 0.92 times the views of its unsponsored ones, with the middle half of channels between 0.65 and 1.24. That is close to no difference.
What this means if you are vetting a channel
- Use views per subscriber, not subscribers. A subscriber count is a lifetime total. Recent views are the audience a sponsor actually buys.
- Compare against the right group. A 3% ratio is in the bottom quarter of tech channels (their 25th percentile is 5.0%) but above the bottom quarter of 25M+ channels (2.2%). Use the size and niche tables above.
- Look at the date of the last long-form upload. 16% of big channels in this study had not posted one in three months.
- Then check the signals a ratio cannot show. Comment quality, growth history and audience location need a closer look. Our free authenticity checker reads a YouTube or Twitch channel’s public data and explains each signal, and the methodology says exactly how. Our guide to the views-to-subscriber ratio covers the red flags in more detail.
If you are a creator, the same numbers give you a fair benchmark. A 1M–5M channel whose typical video earns 9% of its subscriber count is exactly at the median of this group, whatever a growth guru’s rule of thumb says.
Reusing the data
The CSV has one row per channel with every figure in this article. The JSON adds every video: its ID, publish date, views, likes and whether its description disclosed a sponsor, so you can check any number above against YouTube. Both are CC BY 4.0. Please credit “So Influential” and link to this page.
Sources: YouTube channel pages for subscriber counts, and YouTube’s public RSS feeds for each channel’s long-form and Shorts upload playlists (youtube.com/feeds/videos.xml?playlist_id=…), all read October 28, 2026. The collection and analysis scripts are scripts/collect-youtube-study.mjs and scripts/analyze-youtube-study.mjs in this site’s source.
Want more like this?
Get new guides and checker updates by email.