Tech YouTubers by the Numbers: 58 Channels Measured
Free check
See if a creator's audience is real — free, no login.
Tech is YouTube’s busiest and most sponsored niche, and its audiences still show up. Across the 58 tech channels in our directory, a typical long-form video earned views equal to 10.3% of the channel’s subscriber count on October 28, 2026, tied with finance for the highest median of the six niches we studied. Tech channels also post the most, a median of five long-form videos in 30 days, and they disclose sponsors far more often than anyone else.
Key findings
- Median views per subscriber: 10.3%, against 7.8% across all 309 channels in our study.
- Median like rate: 1.87%, slightly below the study-wide 2.11%. Tech viewers often arrive from search to research a purchase.
- 173 of 870 recent long-form uploads (19.9%) disclosed a sponsor in the description, on 35 of 58 channels. No other niche came close; food was next at 8.7%.
- Only 3 of 58 channels had gone 90 days without a long-form upload, the fewest of any niche.
- Shorts trail long-form on 41 of 49 tech channels with enough of both.
Who reaches the most of their audience
Among channels that had posted a long-form video in the last 30 days, these had the highest views per subscriber:
| Channel | Subscribers | Views per subscriber | Latest long-form upload |
|---|---|---|---|
| Code Bullet | 3.5M | 60.8% | 22 days ago |
| Marques Brownlee | 21.4M | 51.7% | 7 days ago |
| Cleo Abram | 8.9M | 41.9% | 11 days ago |
| Mrwhosetheboss | 23.0M | 41.2% | 7 days ago |
| Fireship | 4.3M | 40.9% | today |
Marques Brownlee stands out: with 21.4 million subscribers and seven long-form videos a month, his typical upload still reaches about half his subscriber count. At that size the study-wide median is under 8%.
The sponsorship niche
One in five tech uploads names a sponsor in its description, with phrasing such as “sponsored by” or “thanks to … for sponsoring”. That is a floor, since many sponsors are disclosed only in the video, but it is still more than double any other niche in our study. For brands, that means tech audiences are used to sponsored segments, and it means competition for slots. For a fair price, run expected views through our YouTube CPM calculator.
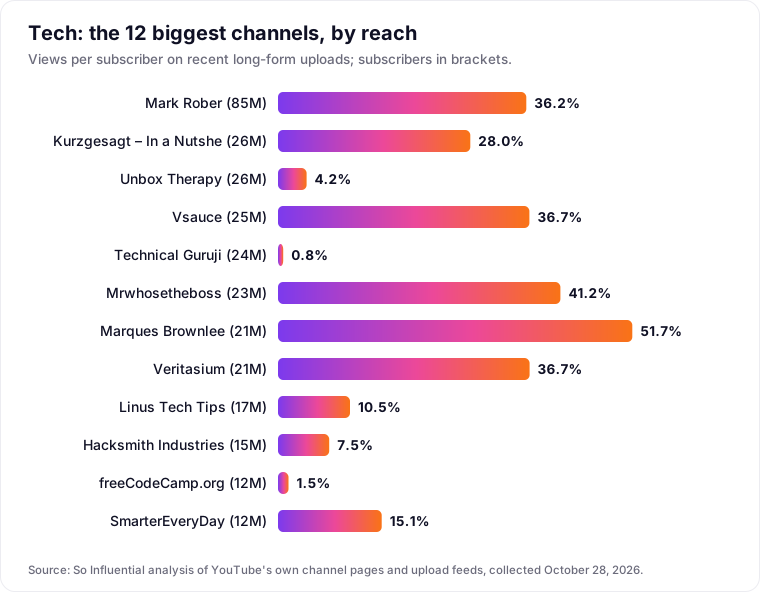
Three of the 58 channels were under 1% views per subscriber: two publishers, The Verge and Engadget, and Technical Guruji, one of the largest channels in the niche. A low ratio is a question to ask, not a verdict.
The full table
Every tech channel in our directory, by subscriber count. “Median views per long-form video” and “views per subscriber” use uploads at least a week old; a dash means the channel had fewer than five such uploads in its latest 15.
| # | Channel | Subscribers | Median views per long-form video | Views per subscriber | Like rate | Latest long-form upload |
|---|---|---|---|---|---|---|
| 1 | Mark Rober | 84.9M | 30.7M | 36.2% | 1.31% | 4 days ago |
| 2 | Kurzgesagt – In a Nutshell | 25.8M | 7.2M | 28.0% | 2.98% | 1 day ago |
| 3 | Unbox Therapy | 25.6M | 1.1M | 4.2% | 0.27% | today |
| 4 | Vsauce | 25.3M | 9.3M | 36.7% | 4.33% | 469 days ago |
| 5 | Technical Guruji | 23.7M | 178K | 0.8% | 1.08% | today |
| 6 | Mrwhosetheboss | 23.0M | 9.5M | 41.2% | 1.60% | 7 days ago |
| 7 | Marques Brownlee | 21.4M | 11.1M | 51.7% | 1.36% | 7 days ago |
| 8 | Veritasium | 21.4M | 7.9M | 36.7% | 2.28% | 5 days ago |
| 9 | Linus Tech Tips | 16.9M | 1.8M | 10.5% | 1.50% | today |
| 10 | Hacksmith Industries | 15.3M | 1.1M | 7.5% | 3.18% | 20 days ago |
| 11 | freeCodeCamp.org | 12.0M | 184K | 1.5% | 1.02% | today |
| 12 | SmarterEveryDay | 11.9M | 1.8M | 15.1% | 3.52% | 32 days ago |
| 13 | JerryRigEverything | 10.2M | 2.2M | 22.1% | 1.42% | today |
| 14 | Cleo Abram | 8.9M | 3.7M | 41.9% | 2.10% | 11 days ago |
| 15 | ElectroBOOM | 8.9M | 670K | 7.5% | 4.39% | 3 days ago |
| 16 | iJustine | 7.1M | 277K | 3.9% | 1.39% | 4 days ago |
| 17 | Austin Evans | 5.8M | 669K | 11.4% | 1.27% | 4 days ago |
| 18 | NetworkChuck | 5.5M | 578K | 10.6% | 1.93% | 1 day ago |
| 19 | ColdFusion | 5.2M | 1000K | 19.0% | 2.85% | today |
| 20 | Programming with Mosh | 5.2M | 274K | 5.3% | 2.69% | 218 days ago |
| 21 | Lex Fridman | 5.1M | 1.2M | 24.3% | 1.84% | 1 day ago |
| 22 | Stuff Made Here | 4.8M | 5.5M | 114.9% | 3.61% | 83 days ago |
| 23 | JayzTwoCents | 4.3M | 414K | 9.5% | 1.87% | today |
| 24 | Fireship | 4.3M | 1.8M | 40.9% | 1.34% | today |
| 25 | Techquickie | 4.3M | 217K | 5.0% | 1.86% | 5 days ago |
| 26 | TechSource | 4.2M | 339K | 8.1% | 1.98% | 3 days ago |
| 27 | Dave2D | 3.7M | 778K | 21.1% | 2.26% | 7 days ago |
| 28 | The Verge | 3.5M | 34K | 1.0% | 0.72% | today |
| 29 | Code Bullet | 3.5M | 2.1M | 60.8% | 5.09% | 22 days ago |
| 30 | UrAvgConsumer | 3.5M | 209K | 6.0% | 0.98% | 1 day ago |
| 31 | Android Authority | 3.5M | 132K | 3.8% | 0.85% | 5 days ago |
| 32 | Geekyranjit | 3.3M | 182K | 5.5% | 0.98% | 4 days ago |
| 33 | ThioJoe | 3.1M | 90K | 2.9% | 2.71% | 4 days ago |
| 34 | David Bombal | 3.1M | 157K | 5.0% | 0.50% | 5 days ago |
| 35 | Gamers Nexus | 2.7M | 964K | 35.3% | 2.28% | 2 days ago |
| 36 | Computerphile | 2.6M | 121K | 4.6% | 1.60% | today |
| 37 | ShortCircuit | 2.5M | 211K | 8.3% | 1.25% | 1 day ago |
| 38 | Jonathan Morrison | 2.5M | 53K | 2.1% | 4.72% | 3 days ago |
| 39 | Traversy Media | 2.4M | 78K | 3.2% | 2.52% | 5 days ago |
| 40 | SuperSaf | 2.3M | 229K | 10.1% | 0.88% | 4 days ago |
| 41 | GreatScott! | 2.2M | 306K | 14.1% | 3.75% | 3 days ago |
| 42 | randomfrankp | 2.2M | 174K | 8.0% | 1.61% | today |
| 43 | Flossy Carter | 2.1M | 90K | 4.2% | 1.89% | today |
| 44 | Tech With Tim | 2.1M | 47K | 2.2% | 0.81% | today |
| 45 | TechLinked | 2.0M | 492K | 24.8% | 2.69% | 1 day ago |
| 46 | Strange Parts | 2.0M | 213K | 10.9% | 3.75% | 64 days ago |
| 47 | Hardware Canucks | 1.9M | 128K | 6.7% | 1.20% | 3 days ago |
| 48 | Two Minute Papers | 1.8M | 269K | 14.6% | 1.68% | today |
| 49 | PhoneBuff | 1.7M | 508K | 30.1% | 1.41% | 3 days ago |
| 50 | ZONEofTECH | 1.7M | 84K | 5.0% | 1.11% | today |
| 51 | Paul’s Hardware | 1.6M | 204K | 13.1% | 2.79% | 3 days ago |
| 52 | Engadget | 1.4M | 12K | 0.8% | 0.76% | today |
| 53 | MrMobile [Michael Fisher] | 1.3M | 370K | 28.9% | 2.30% | 1 day ago |
| 54 | Snazzy Labs | 1.3M | 375K | 29.5% | 2.61% | 6 days ago |
| 55 | Max Tech | 1.3M | 116K | 9.1% | 1.29% | today |
| 56 | Sara Dietschy | 933K | 50K | 5.4% | 4.29% | 29 days ago |
| 57 | TechAltar | 805K | 228K | 28.4% | 3.43% | 42 days ago |
| 58 | Gerald Undone | 487K | 112K | 23.1% | 3.30% | 98 days ago |
How we measured it
On October 28, 2026 we read two public YouTube sources for every channel: the subscriber count shown on the channel page, and YouTube’s own upload feed for the channel’s long-form videos (the “Videos” tab), which lists the 15 latest uploads with their view and like counts. Views per subscriber is the median view count of those uploads that were at least a week old, divided by subscribers. Like rate is likes divided by views, the median across the same videos. Views are lifetime-to-date, so a channel that posts rarely has older videos in its window, which have had longer to collect views; read the “latest upload” column alongside the ratio. Full method, caveats and the downloadable dataset: our study of 312 big YouTube channels.
The channel list is the Tech section of our creator directory, not every tech channel on YouTube. Each name links to its page on our free authenticity checker, which reads the channel’s public data and explains each signal; nothing in this table is an authenticity score.
Sources: YouTube channel pages and YouTube’s public upload feeds for each channel’s long-form videos, read October 28, 2026 (dataset, CSV; example feed).
Want more like this?
Get new guides and checker updates by email.